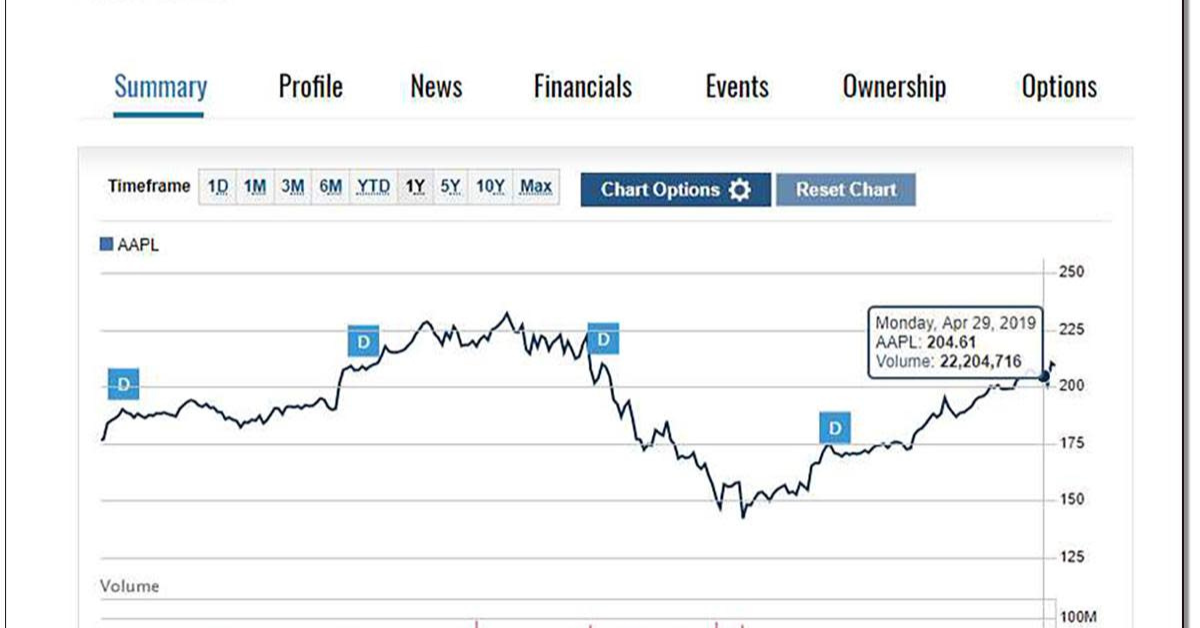
Understanding how to read a stock quote is an essential skill for anyone interested in investing in the stock market. Stock quotes provide crucial information about a company’s stock performance and can help you make informed decisions about buying or selling shares. This article will guide you through the components of a stock quote and how to interpret them effectively.
What is a Stock Quote?
A stock quote is a snapshot of a company’s stock price and various other related metrics at a specific point in time. Quotes can be found on financial news websites, stock market apps, and trading platforms. They can be presented in real-time or with a slight delay, depending on the source.
Components of a Stock Quote
Here are the main components you will find in a typical stock quote:
- Ticker Symbol:
This is a unique series of letters representing a company’s stock. For example, the ticker symbol for Apple Inc. is AAPL, while the symbol for Google’s parent company, Alphabet Inc., is GOOGL. Ticker symbols are essential for identifying stocks quickly. - Last Price:
This is the most recent price at which the stock was traded. It reflects the latest transaction and is a crucial indicator of the stock’s current market value. - Change:
The change indicates how much the stock price has moved compared to the previous trading day’s closing price. This can be expressed as a dollar amount or a percentage. For instance, if a stock closed at $50 yesterday and opened at $52 today, the change would be +$2 or +4%. - Bid and Ask Prices:
- Bid Price: This is the highest price a buyer is willing to pay for the stock.
- Ask Price: This is the lowest price a seller is willing to accept.
The difference between the bid and ask prices is known as the spread, which can indicate the liquidity of the stock.
- Volume:
Volume shows the number of shares traded during a particular period, usually the current trading day. High volume can suggest strong interest in the stock, either bullish (buying) or bearish (selling). - Market Cap:
Market capitalization (market cap) is the total market value of a company’s outstanding shares. It’s calculated by multiplying the current stock price by the total number of outstanding shares. Market cap helps investors assess the size of a company. - P/E Ratio (Price-to-Earnings Ratio):
The P/E ratio is a valuation metric that compares a company’s current share price to its earnings per share (EPS). A high P/E ratio may indicate that a stock is overvalued, while a low P/E ratio might suggest it’s undervalued. - 52-Week High and Low:
These figures show the highest and lowest prices at which the stock has traded over the past year. They can help investors gauge the stock’s volatility and price range. - Dividend Yield:
If the company pays dividends, the dividend yield indicates how much a company pays out in dividends each year relative to its stock price. It is expressed as a percentage and is useful for income-focused investors. - Earnings Date:
This date indicates when the company is scheduled to report its earnings. Earnings reports can significantly impact stock prices, making it an essential date for traders and investors to watch.
How to Read a Stock Quote
Now that you know the components of a stock quote, let’s discuss how to read one effectively:
- Locate the Ticker Symbol:
Start by finding the stock you’re interested in using its ticker symbol. This will help you identify the correct stock quickly. - Analyze the Last Price:
Check the last traded price to see where the stock stands compared to your expectations or previous prices. - Look at the Change:
Determine how much the stock price has changed since the last closing price. A significant change can indicate a market reaction to news or events related to the company. - Check Bid and Ask Prices:
Look at the bid and ask prices to gauge market sentiment. A narrow spread may indicate a more liquid market. - Review the Volume:
High trading volume can signal interest in the stock, while low volume might suggest a lack of interest. - Evaluate Market Cap and P/E Ratio:
Assess the market cap and P/E ratio to understand the company’s size and how it is valued compared to its earnings. - Consider the 52-Week High/Low:
Compare the current price to the 52-week high and low to determine where the stock stands in its historical range. - Check the Dividend Yield:
If you’re interested in income generation, review the dividend yield to see how much income you could earn from dividends relative to your investment. - Keep an Eye on Earnings Dates:
Be aware of upcoming earnings reports, as these can significantly affect stock prices.

Leave a Reply